
How to Make AI Presentations Less Generic (8 Ways)
Learn eight ways to make AI presentations less generic by grounding slides in source material, improving the story, generating a first draft, refining weak pages, and exporting an editable deck.
How to Make AI Presentations Less Generic (8 Ways)
You enter a topic, wait a few minutes, and the AI delivers what looks like a complete presentation: a consistent color palette, tidy cards, appropriate icons, and a perfectly acceptable title on every slide.
Yet when it is time to present, you still hesitate to use it as-is.
The problem usually is not an outdated font or an unpolished template. It is that the deck lacks the evidence, judgment, and narrative that belong to this specific presentation. Headlines read like category labels, slides repeat the same layouts, and images exist only to fill space. More seriously, the AI may present goals as achieved results or speculation as fact.
That is the clearest answer to why do AI presentations look generic: when the input is little more than a broad topic, AI can only produce the most common, middle-of-the-road version of a presentation. If the first draft is then treated as the finished product, that templated feel survives all the way to delivery.
The solution is not simply to add words such as “professional,” “modern,” or “engaging” to the prompt. To understand how to make AI presentations less generic, you need to rethink the entire workflow—from source material and story structure to slide generation and final delivery.
This article explains eight practical ways to do that, with a hands-on Cheso example showing how the process works.
Why Do AI-Generated Presentations Feel So Generic?
1. A vague prompt gives the AI nothing distinctive to work with
“Create a presentation about our product strategy” gives the AI a topic, but says nothing about the audience, the decision the deck must support, the evidence behind its conclusions, or what it must not infer.
Without that context, the model falls back on the usual product-strategy language: market opportunity, growth potential, key differentiators, and next steps. The wording may be perfectly grammatical, but it could apply to almost any company.
Adding “make it professional” usually changes only the surface. It cannot conjure up real data, original judgment, or credible constraints.
2. The slides are designed before the story is decided
Many AI tools immediately expand a topic into ten slides without first answering four more important questions:
- Who will see this presentation?
- What do they need to understand or decide?
- Which piece of evidence matters most?
- What should happen after the presentation?
A slide order that “looks logical” is not necessarily a story that leads an audience toward a decision. Without a clear narrative, every slide may contain information while the deck as a whole still has no point of view.
3. Topic labels replace meaningful headlines
“Market Opportunity,” “Current Situation,” and “Our Solution” classify slides; they do not tell the audience what to conclude from them.
A useful headline expresses a judgment or explains why the slide matters. Ideally, if you removed the body copy and read only the headlines, the audience could still follow the deck’s logic.
4. Every slide receives the same visual treatment
The deck starts to feel templated as soon as every slide uses three cards, a few line icons, centered copy, and the same gradient background. More visual elements do not automatically make the message clearer.
The format should serve the slide’s job: use side-by-side structures to compare options, a process diagram to explain a sequence, a prominent data point to prove impact, and explicit action items when asking for a decision. Visual variety is not the goal. The goal is to align the visual structure with the information structure.
5. The first draft is treated as the final deliverable
AI fills gaps in the logic, and it may also rewrite goals, assumptions, or recommendations as if they have already happened. If no one audits the claims, rewrites the headlines, revises individual slides, or rehearses the story, both the factual risks and the obvious “AI feel” remain in the final deck.
That is why the key to how to improve AI-generated slides is not generation alone. It is a reliable editing process.
What Makes an AI Deck Presentation-Ready?
A complete-looking deck merely has all its pages. A presentation-ready deck must support a real message, a real decision, and further revision. Four criteria help distinguish the two:
| Criterion | Question to ask |
|---|---|
| Source-grounded | Can every major claim be traced to the source material? Are facts, goals, assumptions, and recommendations clearly distinguished? |
| Story-led | Does the sequence support a clear narrative or decision? Will the audience understand why this deserves attention now? |
| Slide-specific | Does each slide have one clear job? Do the headline, evidence, and visuals support the same point? |
| Editable and deliverable | Can the text, slides, and visuals still be revised and carried into presentation, sharing, or PowerPoint workflows? |
Before getting into the detailed workflow, keep these eight principles in mind:
- Start with source material, not an empty prompt.
- Define the audience, the decision, and the speaking goal.
- Build the story before building the slides.
- Generate the first complete presentation from the approved storyline.
- Replace topic labels with evidence-led headlines.
- Give every slide one job.
- Audit every claim the AI adds.
- Revise the weakest slides individually and finish in an editable format.
You can carry out these steps across separate research, writing, design, and presentation tools, but every handoff creates another opportunity for information loss and rework. Cheso keeps source material, story development, slide generation, page-level revision, and final delivery in one presentation workflow.
8 Ways to Make AI Presentations Less Generic
1. Start With Source Material, Not an Empty Prompt
The most direct improvement is to have AI distill real source material instead of freely inventing around a topic.
Your sources might include original documents, research notes, PDFs, Markdown files, data tables, meeting notes, images, partial outlines, or existing templates. They do not have to be perfectly organized, but you should define the boundaries:
- Which information is established fact?
- Which numbers or wording must be preserved?
- Which statements are goals or assumptions?
- Which conclusions is the AI not allowed to add?
- What can be shared publicly, and what must stay out of the deck?
This changes the AI’s job from “invent a familiar set of talking points” to “extract, prioritize, and present the information that already exists.” It removes the templated feel far more effectively than adding more adjectives to a prompt.
In Cheso, you can begin with an idea, file, or template, gather the relevant material in one task, and specify what takes priority and how the material may be used. For example:
Review the following four referenced source files:

- @Gold Price History
- @Macro Indicators
- @Gold Demand Trends
- @Research Boundaries

Do not create slides yet.

Create a concise Source Grounding Note with the following sections:

1. Observed gold-price trend
2. Available macro indicators
3. Gold-demand composition
4. Confirmed facts that may be used in the presentation
5. Interpretations or assumptions that require explicit labeling
6. Claims that cannot be made from the supplied sources

Preserve the original dates, values, units, definitions, and source names.

Use only facts and calculations explicitly contained in the referenced files. Do not introduce additional market data, price targets, forecast probabilities, geopolitical events, policy decisions, investor behavior, causal relationships, or investment recommendations.

Treat the following classifications as mandatory:

- Source fact: explicitly supported by a referenced file
- Scenario assumption: a stated condition used to explore a possible outcome
- AI interpretation: a synthesis requiring human review
- Unsupported addition: information that must not enter the presentation without another source

End with a short list titled “Evidence boundaries for the next step.”
Uploading files and saying “turn this into a PowerPoint” is still not enough. Uploading solves access to the information; defining the boundaries is what makes the content trustworthy.
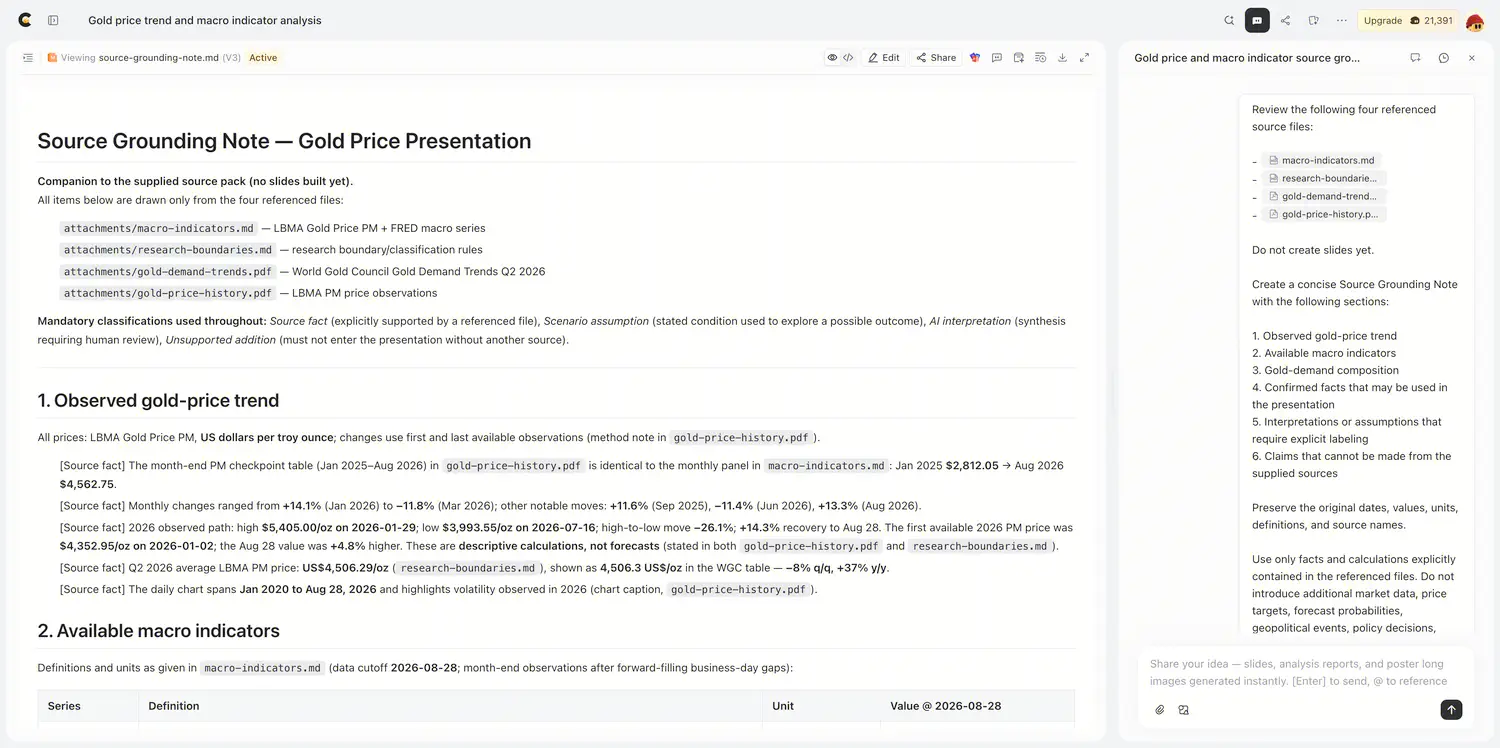
Figure 1: The Source Grounding Note on the left is created from four referenced research files; the prompt on the right defines the evidence boundaries and claim classifications before any slides are generated.
2. Define the Audience, Decision, and Speaking Goal
The same source material should produce very different presentations for executives, customers, classmates, or a project team. Before generating anything, answer three questions:
- Who will see the presentation?
- What do they need to understand or decide?
- What action does the presenter want them to take?
Using the Source Grounding Note from the previous step and the following referenced files, create a Presentation Brief for this project:

- @Gold Price History
- @Macro Indicators
- @Gold Demand Trends
- @Research Boundaries

Use the following parameters:

Audience:
Internal investment committee.

Decision required:
Determine whether the available evidence supports an overweight, neutral, or underweight research stance on gold.

Time horizon:
The next 6–12 months.

Current situation:
Gold remains in a higher price regime, but its 2026 path has been volatile. The committee needs to determine whether the available price, macro, and demand evidence supports the durability of that regime.

Speaking goal:
Explain the observed gold-price trend, identify evidence that supports or challenges its durability, and define the observable signals that should cause the committee to reconsider its view.

Supporting evidence:
Use only the four referenced source files and the Source Grounding Note created in the previous step.

Constraints:

- Preserve all source dates, figures, units, and definitions.
- Distinguish observed facts from scenarios and interpretations.
- Do not invent a gold-price target.
- Do not assign probabilities to scenarios.
- Do not claim that real yields, the US dollar, ETF flows, central-bank demand, or any other variable caused the observed price move.
- Do not provide personalized investment advice or a trade instruction.

Desired tone:
Evidence-led, restrained, analytical, and decision-oriented.

Presentation length:
Exactly seven slides.

Do not create slides yet.

Return the brief under these headings:

1. Audience
2. Decision required
3. Time horizon
4. Speaking goal
5. Questions the presentation must answer
6. Evidence that may be used
7. Content and claim boundaries
8. Desired audience action
Do not stop at:
Create a presentation about the outlook for gold.
A better prompt defines the audience, the decision, the time horizon, the evidence that may be used, and the claims the presentation must avoid. The more specific these boundaries are, the easier it is for the AI to decide what belongs on the opening slide, which evidence deserves space, and which unsupported interpretations must stay out.
In this Cheso example, the audience is an internal investment committee and the required decision is whether the available evidence supports an overweight, neutral, or underweight research stance on gold over the next 6–12 months. The brief also limits the deck to the supplied research files and explicitly prohibits price targets, forecast probabilities, invented events, causal claims, and personalized investment advice.
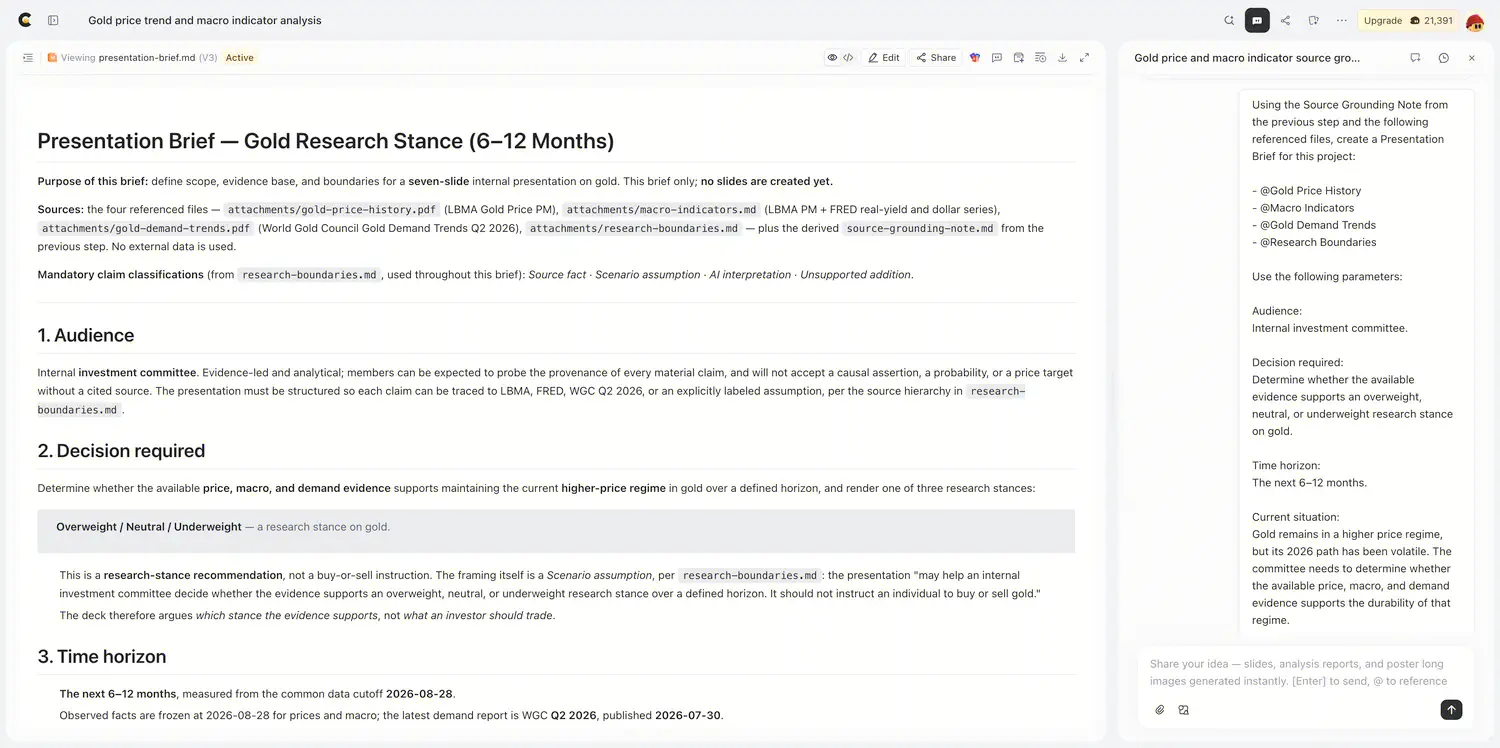
Figure 2: The Presentation Brief defines the internal investment committee, the required research decision, the 6–12-month horizon, the permitted evidence, and the claims the presentation must avoid.
3. Build the Story Before You Build the Slides
Before choosing a template or slide layout, turn the story into a logical sequence you can review.
A decision-oriented presentation often follows a structure like this:
- Decision requested
- Current problem
- Supporting evidence
- Proposed approach
- Risks and safeguards
- Success metrics
- Required resources
- Next steps
This is not an eight-slide template to follow mechanically. Related ideas can be combined, and complex issues can be split across several slides. The real test is whether each step gives the audience what they need for the next one and whether the sequence leads naturally to the requested decision.
In Cheso, you can first ask it to organize the research, extract insights, or draft a slide-by-slide outline, then generate slides only after the story works. For example:
Using the Source Grounding Note and Presentation Brief from the previous steps, organize the material into a seven-slide decision-oriented story.

Use the following referenced files as the evidence base:

- @Gold Price History
- @Macro Indicators
- @Gold Demand Trends
- @Research Boundaries

Do not create slides yet.

Use exactly this narrative sequence:

1. Decision required
2. Observed gold-price trend
3. Macro indicators
4. Gold-demand mix
5. Monitoring signals
6. Bull, Base, and Bear scenarios
7. Decision framework and review triggers

For each proposed slide, provide:

- Slide number
- A working evidence-led headline
- The slide’s single job
- The question it answers for the committee
- The specific evidence it will use
- The referenced source file
- The required claim classification: source fact, scenario assumption, or AI interpretation
- The most suitable visual format
- Information that must not appear on the slide

Apply these rules:

- Each slide must perform one clear job.
- The sequence must lead naturally to the decision on slide 7.
- Quantitative slides must use the original units and show the source and data cutoff.
- Working headlines should communicate a conclusion, not merely name a topic.
- The scenario slide may contain conditions, observable triggers, and directional implications only.
- Do not create price targets or forecast probabilities.
- Do not describe sample correlations as causal relationships.
- Remove information that does not help the committee reach or review the stated decision.

End with a “Headline-only story test” that lists the seven working headlines in sequence.

Do not generate the presentation until I approve the storyline.
The seven-slide example in the screenshot builds a sequence from the committee’s decision to the observed price trend, macro indicators, demand mix, monitoring signals, Bull/Base/Bear scenarios, and a final decision framework. Each slide has a distinct job, and the storyline can be approved before any slides are generated.
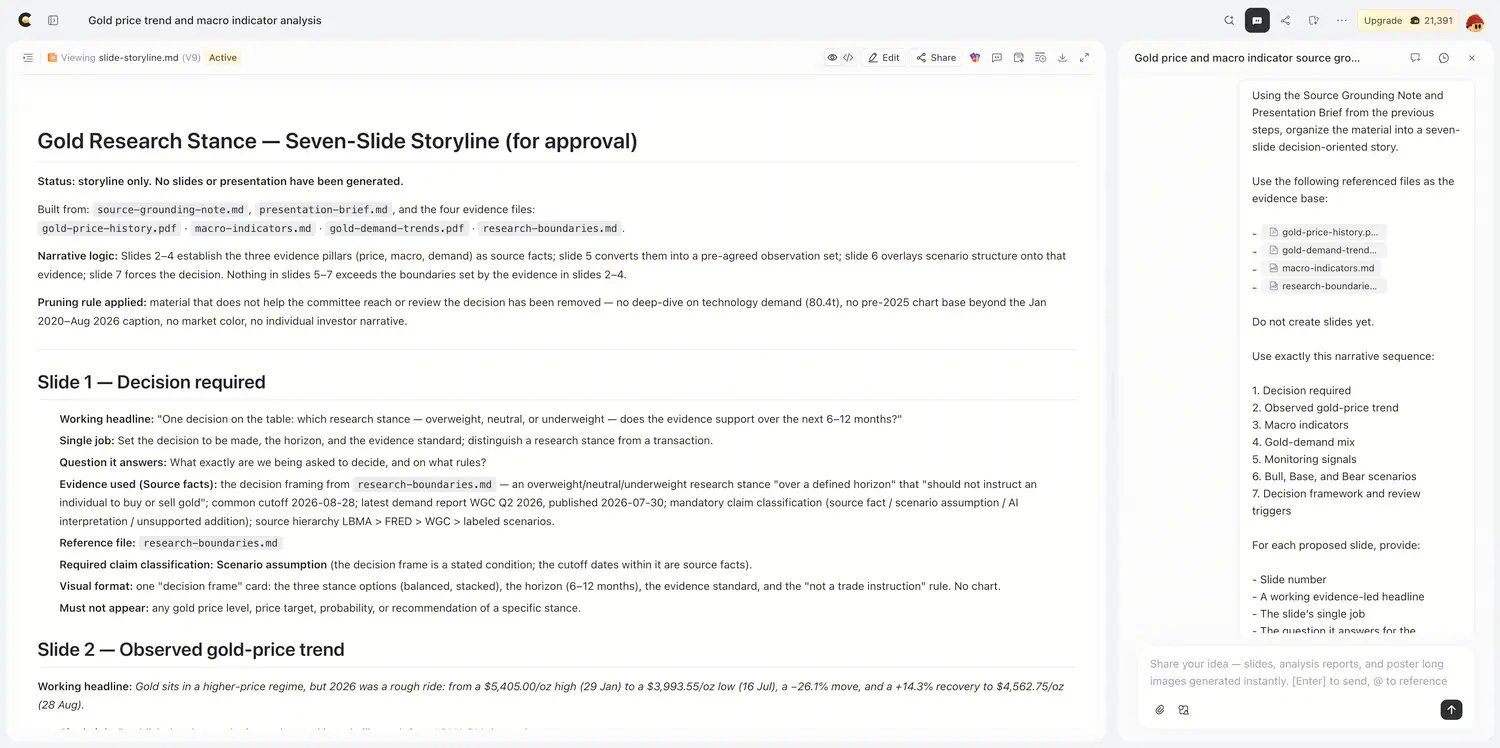
Figure 3: Cheso organizes the research into a seven-slide storyline for approval before generation, specifying each slide’s headline, job, evidence source, claim classification, and visual format.
4. Generate the Presentation
Once the source boundaries, presentation brief, and slide-by-slide storyline have been reviewed, generate the first complete presentation. This is where the approved logic becomes a visual draft you can evaluate as a whole—not where human review ends.
Keep the generation request tied to the decisions made in the previous steps. The AI should follow the approved slide order, preserve each slide’s single job, use the assigned evidence, and maintain the distinction between source facts, assumptions, and interpretation. For example:
Create an AI Slides presentation using the approved seven-slide storyline from the previous step.

Use the following referenced files as the factual foundation:

- @Gold Price History
- @Macro Indicators
- @Gold Demand Trends
- @Research Boundaries

Create exactly seven slides. Do not add an appendix or an extra title slide.

Follow the approved slide order, single-slide jobs, evidence assignments, and claim classifications.

Content rules:

- Use only facts, dates, figures, and calculations explicitly contained in the referenced sources.
- Preserve the original units and definitions.
- Show the relevant source and data cutoff on every quantitative slide.
- Distinguish source facts, scenario assumptions, and AI interpretation.
- Do not invent price targets, forecast probabilities, macroeconomic events, geopolitical events, central-bank purchases, ETF flows, investor behavior, or causal relationships.
- Do not provide personalized investment advice or a direct buy-or-sell instruction.
- The final slide should support an internal committee discussion about an overweight, neutral, or underweight research stance.

Design rules:

- Use a restrained investment-research visual style.
- Use a dark navy background with warm gold highlights.
- Use high-contrast charts and clear numerical hierarchy.
- Use limited decoration.
- Give every slide one dominant visual idea.
- Prefer charts, comparisons, and decision frameworks over decorative stock photography.
- Keep source notes legible.
- Use the evidence-led working headlines from the approved storyline.

After generating the presentation, briefly confirm:

1. The number of slides created
2. Which source supports each quantitative slide
3. Which slides contain scenarios or interpretation rather than observed facts
In Cheso, the approved outline and referenced files remain in the same task when you move into AI Slides, so the first deck can be generated from the context you have already reviewed. Treat the result as a working presentation: check the complete narrative first, then use the following steps to improve individual headlines, slide jobs, claims, and layouts without discarding the parts that already work.
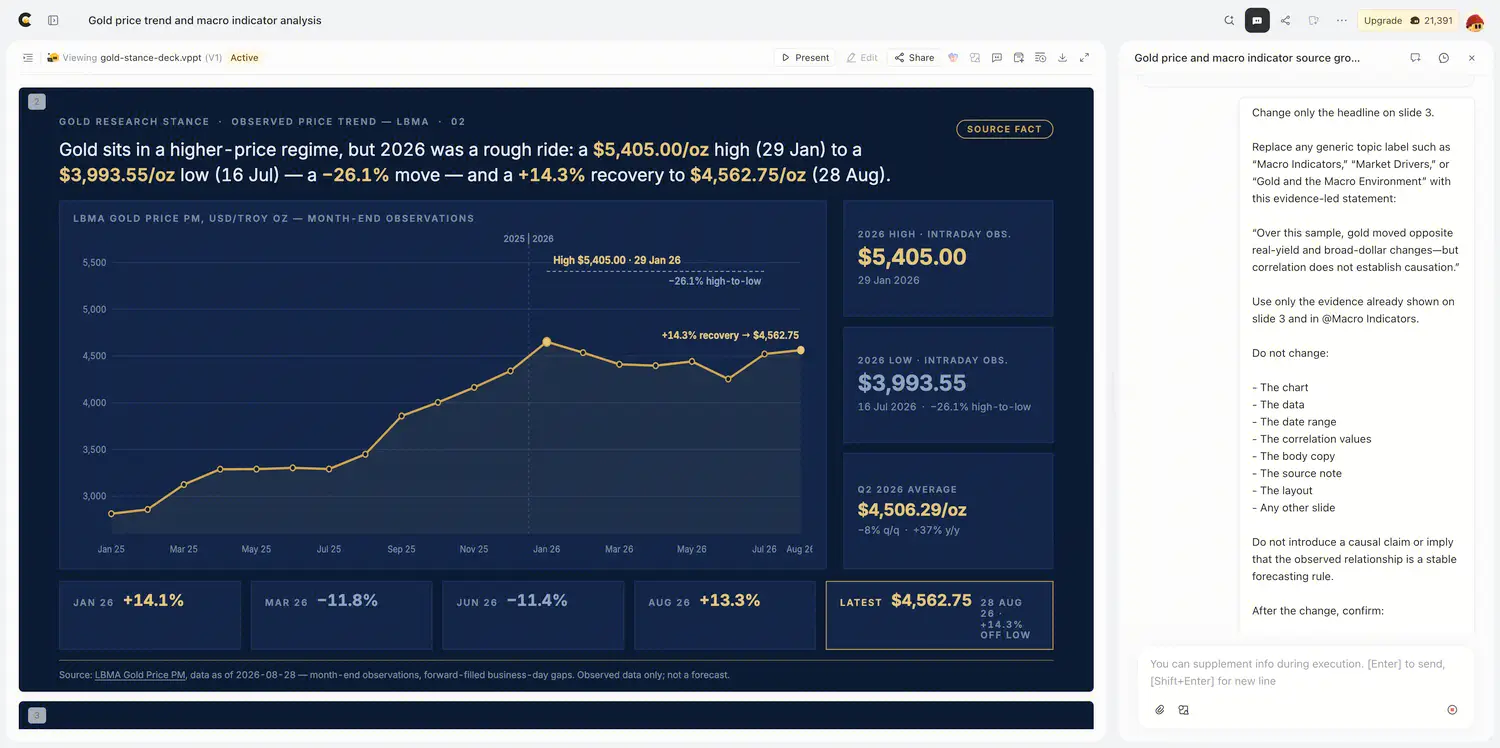
Figure 4: The generated seven-slide gold-research deck is open in AI Slides, with the observed price-trend slide shown and the same task ready for targeted follow-up refinement.
5. Replace Topic Labels With Evidence-Led Headlines
A topic label tells the audience which category a slide belongs to. An evidence-led headline tells them what the slide means.
For example:
- Before: Gold and the Macro Environment
- After: Over this sample, gold moved opposite real-yield and broad-dollar changes—but correlation does not establish causation.
Stronger headlines often follow a “fact + meaning” or “change + impact” structure. Once you have written them, try a simple test: remove all the body copy. Does the story still make sense when you read only the headlines?
In Cheso, you do not need to regenerate the entire deck. You can target one slide, ask for a headline rewrite only, and prohibit new claims:
Change only the headline on slide 3.

Replace any generic topic label such as “Macro Indicators,” “Market Drivers,” or “Gold and the Macro Environment” with this evidence-led statement:

“Over this sample, gold moved opposite real-yield and broad-dollar changes—but correlation does not establish causation.”

Use only the evidence already shown on slide 3 and in @Macro Indicators.

Do not change:

- The chart
- The data
- The date range
- The correlation values
- The body copy
- The source note
- The layout
- Any other slide

Do not introduce a causal claim or imply that the observed relationship is a stable forecasting rule.

After the change, confirm:

1. The old headline
2. The new headline
3. That slides 1, 2, 4, 5, 6, and 7 were left unchanged
The revised headline does more than name the topic. It tells the committee what the sample shows while making the evidence boundary explicit: the relationship is descriptive, not proof of causation or a stable forecasting rule.
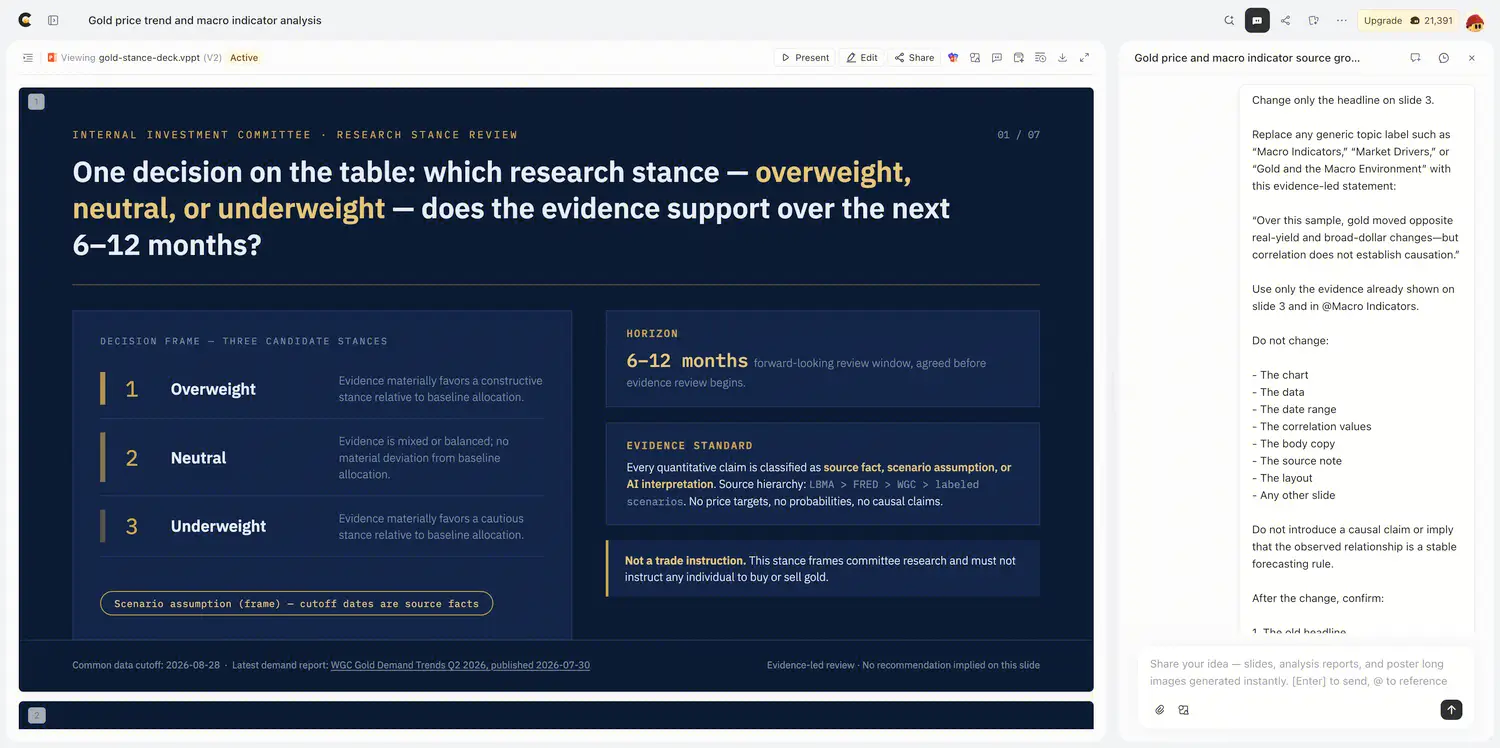
Figure 5: The deck uses a decision-led headline on the left, while the prompt on the right targets only slide 3’s headline and keeps its chart, data, source note, layout, and every other slide unchanged.
6. Give Every Slide One Job
“One job per slide” does not mean a slide can contain only one type of element. It means every element should help answer the same question.
Common slide jobs include:
- Ask for a decision
- Explain a problem
- Prove impact
- Compare options
- Reduce perceived risk
- Show a plan
- Request action
The visual format should follow the job as well. Use a prominent number or chart for a quantitative conclusion, a process diagram for a sequence, and a side-by-side structure for a comparison. Do not cram in long paragraphs, decorative images, several icons, and unrelated data cards simply to make a slide look “richer.”
In Cheso, assign a clear job to a specific slide and ask it to remove anything that does not serve that purpose:
Change slide 4 only.

The only job of slide 4 is to help the committee understand how Q2 2026 gold demand was distributed across major demand segments.

Use @Gold Demand Trends as the source.

Keep the following source facts visible:

- Total demand including OTC: 1,268.9 tonnes
- Total demand including OTC was unchanged year over year
- Central-bank demand: 288.9 tonnes
- Total bar-and-coin demand: 307.1 tonnes
- ETF flows: -44.8 tonnes
- Jewellery consumption: 278.2 tonnes
- The source period is Q2 2026

Use a clear horizontal comparison chart or a similarly direct quantitative layout.

The headline should communicate this conclusion:

“Q2 2026 gold demand was stable in total volume, but its mix shifted.”

Remove anything that does not support this single job, including:

- Macroeconomic commentary
- Price forecasts
- Scenario conclusions
- Investment recommendations
- Decorative imagery
- Repeated explanations already covered on other slides
- Claims that total demand showed broad-based growth

Preserve a legible World Gold Council source note.

Do not change slides 1, 2, 3, 5, 6, or 7.

After the change, briefly list:

1. What was retained
2. What was removed
3. Why the revised slide now has one clear job
The total, segment values, year-over-year comparison, and source period are different kinds of information, but they all answer one question: how was Q2 2026 gold demand distributed across major segments? The slide keeps that comparison direct and does not drift into macro commentary, price forecasts, scenario conclusions, or investment recommendations.
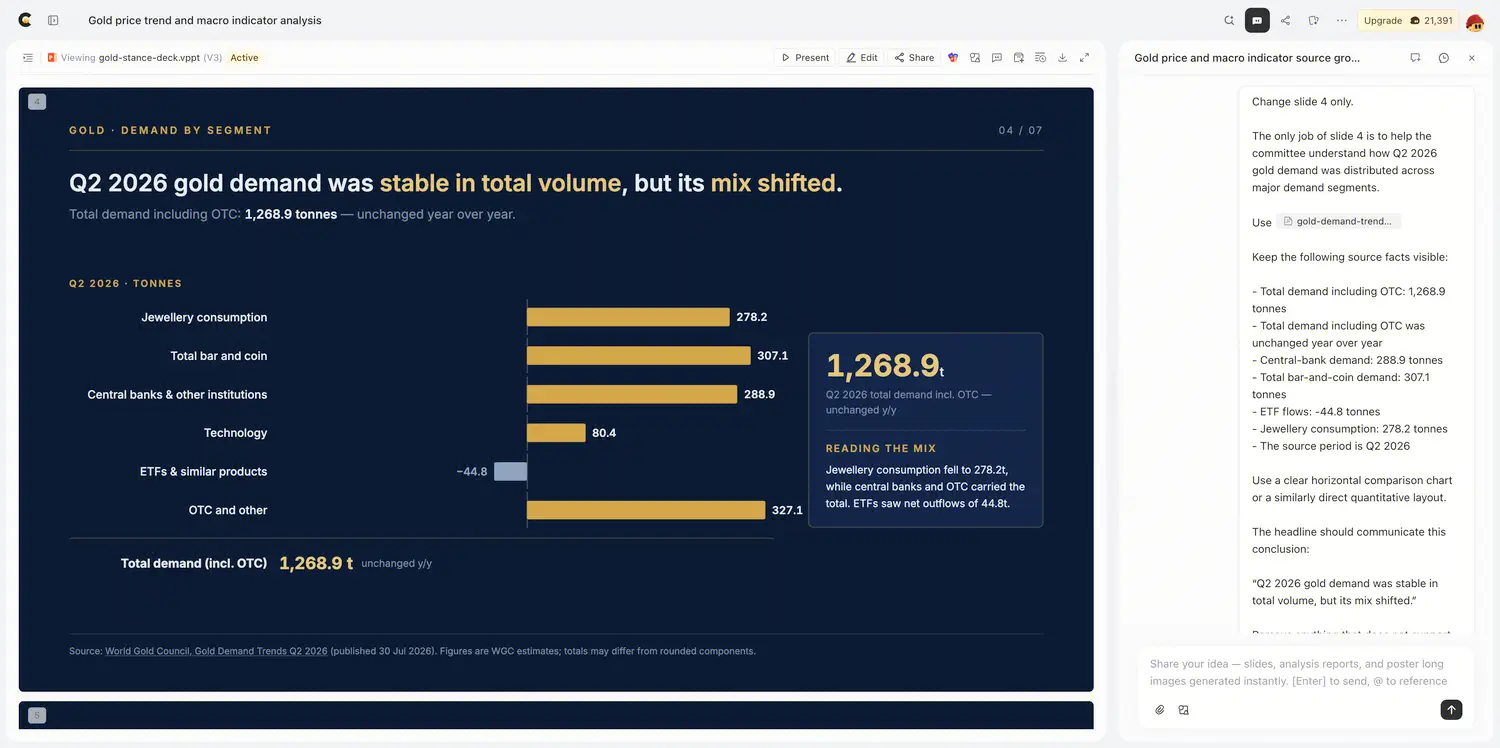
Figure 6: Slide 4 uses a direct horizontal comparison to explain the Q2 2026 gold-demand mix, retaining the required source facts while excluding unrelated commentary and recommendations.
7. Audit Every Claim the AI Added
More specific input reduces errors, but it does not replace a final fact-check. After generation, classify every important claim in the deck into one of four categories:
- Source fact: explicitly stated in the input material
- Scenario assumption: a stated condition used to explore a possible outcome
- AI interpretation: the model’s reading of the material, which requires human judgment
- Unsupported addition: not supported by the source and therefore needs evidence or should be removed
Pay particular attention to whether the AI has:
- Turned an observed or historical price into a forecast
- Described correlation between gold and macro indicators as causation
- Presented flat total demand as broad-based growth
- Turned negative ETF flows into a prediction about future investor behavior
- Invented price targets, scenario probabilities, or future market events
You can ask Cheso to conduct a strict, slide-by-slide audit, provided the rules are specific enough:
Conduct a strict, slide-by-slide audit of the complete seven-slide presentation against the following referenced files:

- @Gold Price History
- @Macro Indicators
- @Gold Demand Trends
- @Research Boundaries

Review every important headline, number, conclusion, label, annotation, and scenario statement.

Classify each material claim as one of:

1. Source fact
2. Scenario assumption
3. AI interpretation
4. Unsupported addition

Apply the following actions:

- Preserve source facts, including their dates, units, definitions, and source notes.
- Clearly label scenario assumptions.
- Rewrite AI interpretations so they are presented as interpretations rather than established facts.
- Remove unsupported additions unless another referenced source explicitly supports them.
- Replace causal language with descriptive language when the source establishes only association or correlation.
- Replace guaranteed outcomes with conditional language.
- Do not convert a scenario into a forecast.

Pay particular attention to these checks:

- Do not describe the 2026 high, low, or latest gold price as a forecast.
- Do not describe the sample correlation between gold, real-yield changes, and broad-dollar returns as causation.
- Do not claim that Q2 2026 total demand experienced broad-based growth.
- Do not convert negative ETF flows into a claim about future investor behavior.
- Do not invent central-bank purchases beyond the supplied World Gold Council figures.
- Do not add a gold-price target.
- Do not assign a forecast probability to any scenario.
- Do not present an overweight, neutral, or underweight stance as personalized investment advice.
- Do not invent geopolitical events, policy decisions, economic releases, or market reactions.

Make only the content changes required to correct unsupported or overstated claims.

Preserve the established visual system unless a layout adjustment is necessary to fit corrected wording.

When finished, provide a slide-by-slide audit summary containing:

- Claims preserved as source facts
- Scenario assumptions explicitly labeled
- Interpretations rewritten
- Unsupported additions removed
- Slides that required no change
The audit in the screenshot checks each slide against the referenced research: observed prices must not be presented as forecasts, sample correlations must not be described as causation, flat total demand must not become a claim of broad-based growth, and ETF flows must not be used to predict future behavior. It also removes invented price targets, probabilities, events, or market reactions.
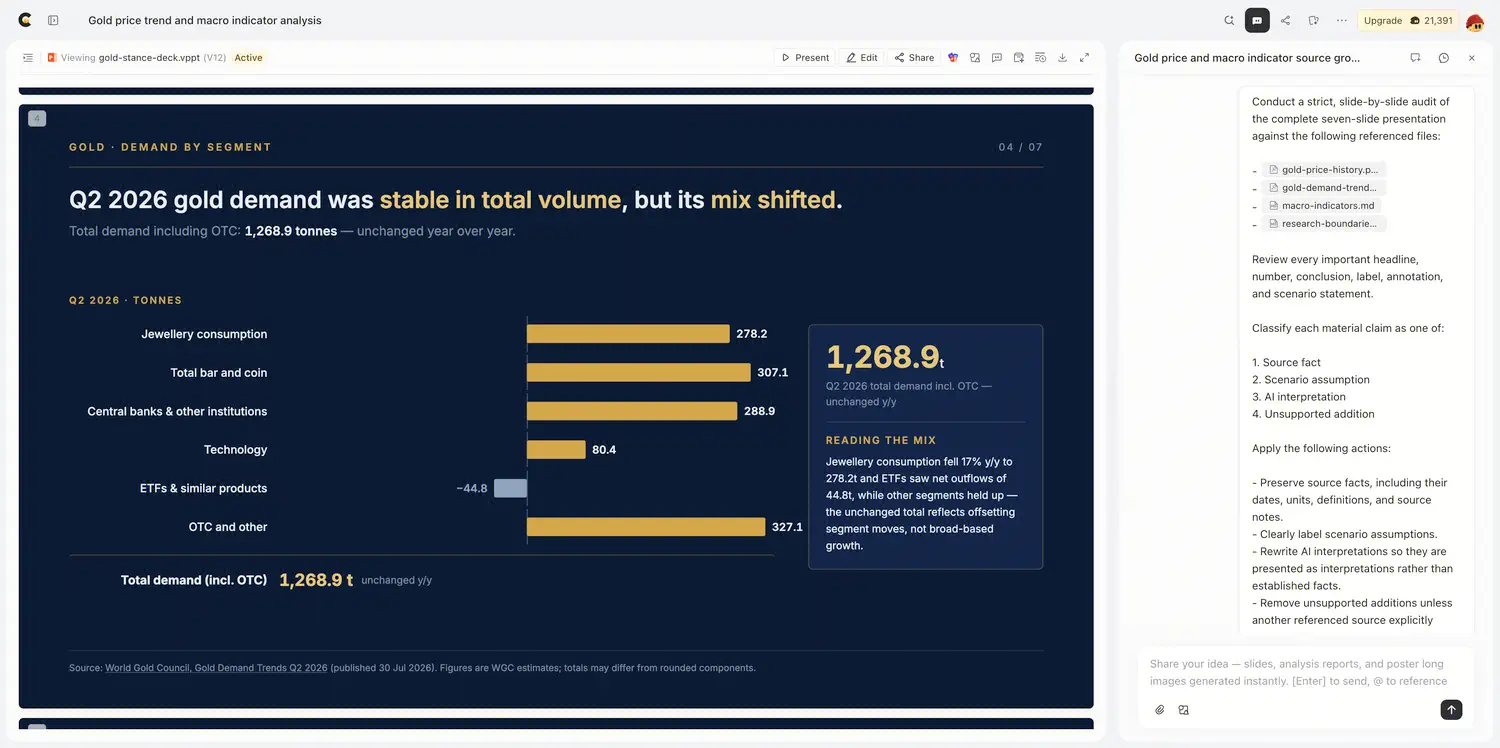
Figure 7: The source-backed gold-demand slide is shown alongside a strict audit prompt that checks source facts, scenario assumptions, AI interpretations, unsupported additions, and non-causal wording.
8. Revise the Weakest Slides Individually—Then Finish in an Editable Format
After generating the first draft, identify the one to three slides that feel most obviously AI-made instead of immediately regenerating the whole deck. Review each one:
- Is the headline merely a topic label?
- Does the slide contain unsupported material?
- Do the visuals match the slide’s job?
- Is the information hierarchy clear?
- Is a necessary evidence or action slide missing?
Then revise only those weak slides. In this example, slide 6 is redesigned as an equal three-column Bull, Base, and Bear comparison. Each column is limited to conditions, observable triggers, and the directional implication for the research stance; no price target or scenario probability is added, and the other six slides remain unchanged.
For this demonstration, treat slide 6 as the selected weak slide.

Change slide 6 only.

The slide’s single job is to compare three conditional scenarios for gold without pretending to forecast a specific price.

Redesign slide 6 as an equal three-column comparison:

- Bull scenario
- Base scenario
- Bear scenario

For each scenario, include only:

1. Conditions
2. Observable triggers
3. Directional implication for the research stance

Apply these rules:

- Label all three columns clearly as scenario assumptions.
- Do not assign probabilities.
- Do not include price targets.
- Do not invent future macroeconomic events, policy decisions, geopolitical developments, central-bank purchases, ETF flows, or investor behavior.
- Do not describe any scenario as guaranteed.
- Use conditional wording such as “if,” “could,” “may,” and “would require reassessment.”
- Use the monitoring framework already established on slide 5.
- Keep the design restrained and consistent with the rest of the presentation.
- Give all three scenarios equal visual weight.
- Preserve any relevant source and methodology notes.

Do not change slides 1, 2, 3, 4, 5, or 7.

After the edit, confirm:

1. Exactly what changed on slide 6
2. Which statements are scenario assumptions
3. That no price target or probability was added
4. That the other six slides remained unchanged

Then review the complete presentation without making further changes and report whether:

- The seven headlines form a coherent story
- Every slide performs one clear job
- Quantitative slides show sources and dates
- Facts, assumptions, and interpretations are distinguishable
- The final decision framework matches the original audience and decision
- Any unsupported claim remains

Do not regenerate the complete presentation.
The benefit of slide-level revision is that one weak page no longer forces you to regenerate the entire deck. Once the targeted edits are complete, review the full presentation from the speaker’s perspective, checking the headline sequence, transitions, numbers, and action request.
Cheso lets you request changes to individual slides, edit content online, and preserve earlier drafts in version history. When the deck is ready, you can preview, present, share, save it as a template, or download an editable PPTX. An editable export brings the file into a real PowerPoint delivery workflow, although you should still verify fonts, animations, media, and layout compatibility in the target software.
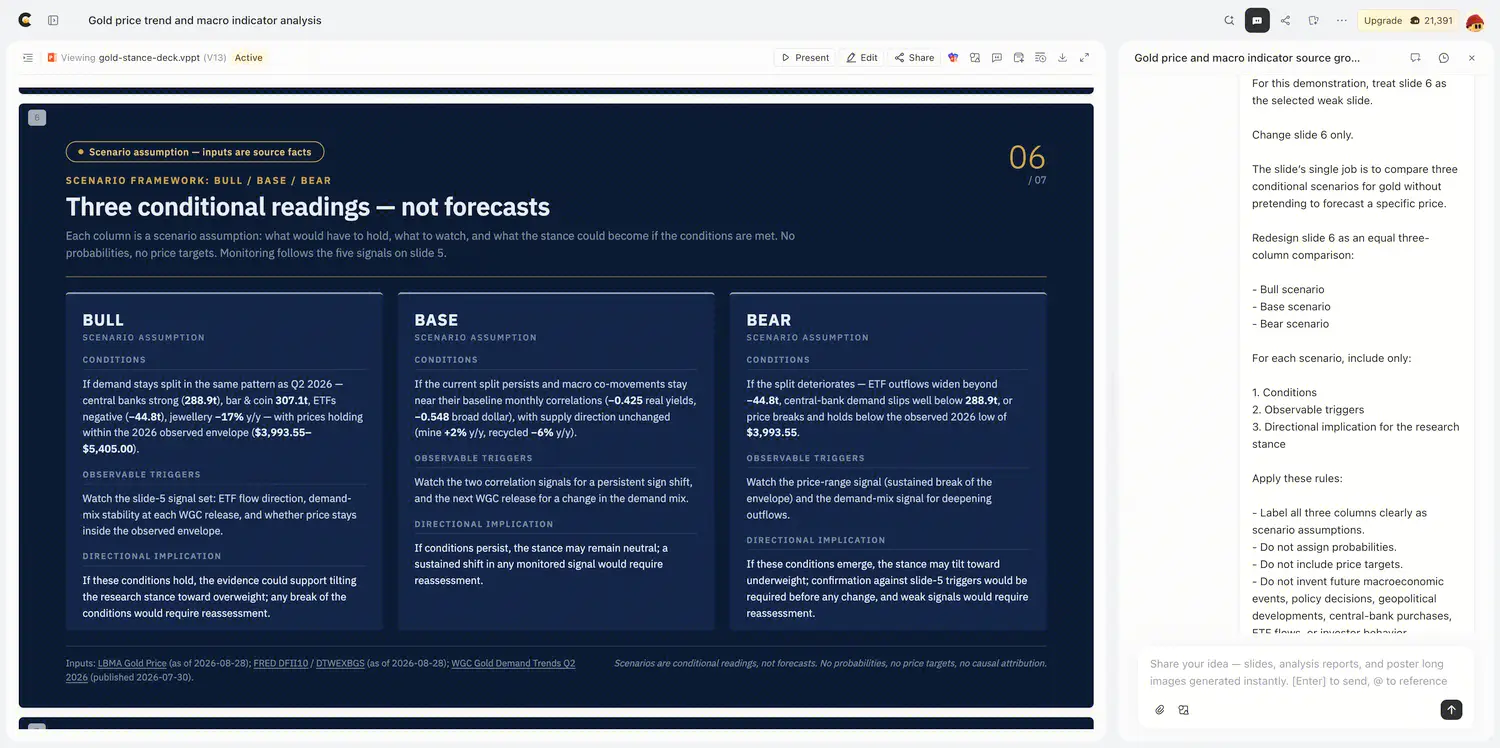
Figure 8: Slide 6 has been redesigned as an equal Bull, Base, and Bear comparison, with each scenario limited to conditions, observable triggers, and directional implications rather than price targets or probabilities.
The method itself is straightforward. It becomes inefficient only when the source files, outline, AI generator, slide editor, and final PowerPoint are scattered across different tools. Cheso keeps those stages in one presentation workspace while leaving the final judgment with the user.
How to Make an AI Presentation Look Professional: A Final Review
If you are looking for how to make an AI presentation look professional, do not end your review with color and alignment. Before delivery, complete at least these six checks:
- Story check: Can you understand the full logic by reading only the headlines?
- Claim check: Can every important number and conclusion be traced to the source material?
- Slide-job check: Does every slide have one clear job?
- Speaker check: Can the presenter explain the connection between slides naturally?
- Editability check: Can the text, slides, and visuals still be revised?
- Delivery check: Does the downloaded PPTX display correctly in the final presentation environment?
This is also the heart of how to edit AI-generated presentations: editing is not a fallback for when generation fails. It is the essential step that turns an average first draft into a specific, credible message. The value of an editable AI presentation is not simply that you can change the words; it is that the facts, story, slides, and visuals all remain open to human judgment.
The Goal Is Not to Remove the AI—It Is to Direct It
AI presentations feel templated not because they use AI, but because the input, story, and revision process are all too generic.
AI is excellent at accelerating research synthesis, story structuring, and slide production. It is not a substitute for final judgment. A more reliable workflow looks like this:
source material → audience and decision → story → first draft → fact check → slide-level refinement → editable delivery
That is the central principle behind how to create better presentations with AI: let AI provide speed, while people remain responsible for direction, evidence, and tradeoffs. When moving an AI presentation to PowerPoint, do not treat static images as the finish line. Keep the deck editable so it can respond to brand standards, the presentation setting, and last-minute feedback.
Don’t stop at the first AI-generated draft. Turn your source material into a structured, editable presentation with Cheso.